BLS report on the characteristics of minimum wage earners in the US reveals some interesting information.
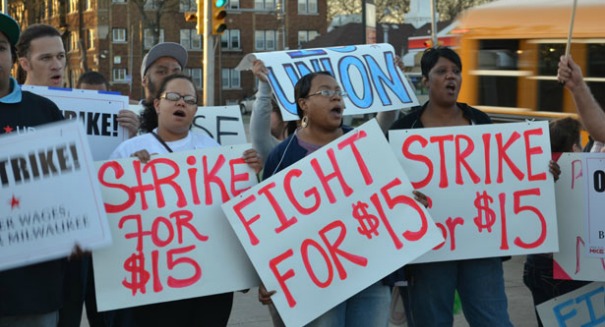
As the argument over raising the minimum wage for American workers continues, it would seem to be a good idea to take a look at some numbers regarding just who actually is the minimum-wage earner. A report from the Bureau of Labor Statistics last month details some very interesting data about the make-up of the class of workers that are making minimum wage or less in the United States.
The report draws its numbers from the Current Population Survey (CPS), described in the report as a monthly survey of approximately, households conducted by the U.S. Census Bureau. The information on earnings is taken from about one quarter of those households and has been collected since 1979.
The data show that 2.2 million workers in the US are currently working for $7.25 per hour, the prevailing federal minimum wage, or less, as of 2016. Percentage wise, that equates to 2.7 percent of all hourly paid workers for that period. The number of those workers has declined steadily, as the chart below reveals, since the inception of the data collection, and that number represents a drop from 3.3 percent in 2015.
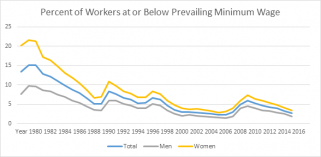
Probably the first thing that you will notice from the chart is that it exposes the percentage of women making minimum wage or less is about three percent, compared to men at two percent. Not surprising so much, as data shows across the nation that women are generally paid less than men, but you may want to look a little closer before making that assumption.
Almost two-thirds of the total hourly workers making minimum wage or less are comprised of workers in the category defined as Service Occupations, which includes sub-categories such as Healthcare support and Food Preparation and Serving. In fact, 52.1 percent of those working for minimum wage are employed in the last category, Food Service, which typically employs many young women.
A caveat here, the survey does not consider overtime pay, tips, or commissions, which in the case of food service workers, such as waitresses in casual dining restaurants, which may distort the real amount of take-home pay somewhat.
The survey found that there was little disparity in the ethnicity of these workers, with White and Black workers at about three percent each, while Asian and Hispanic came in slightly lower at two percent.
As one would expect, minimum wage workers tend to be young. Workers under the age of 25 make up about 20 percent of the total hourly workers, but they also compromise about half of those working for less. Amazingly though, 90 percent of employed teenagers (aged 16-19) were working for more than the prevailing federal minimum wage. Comparatively speaking, that number for workers 25 and older jumps to 98 percent.
Interestingly, two percent of hourly workers working for minimum wage or less reported having a college degree, compared to three percent each for those with some college or an associate degree, and high school graduates. Of all hourly workers 16 and over, about five percent of those working at minimum and below failed to finish high school.
The total number of hourly workers in the United States in 2016 was 79.9 million, representing 58.7 percent of all wage and salary workers, according to the report.